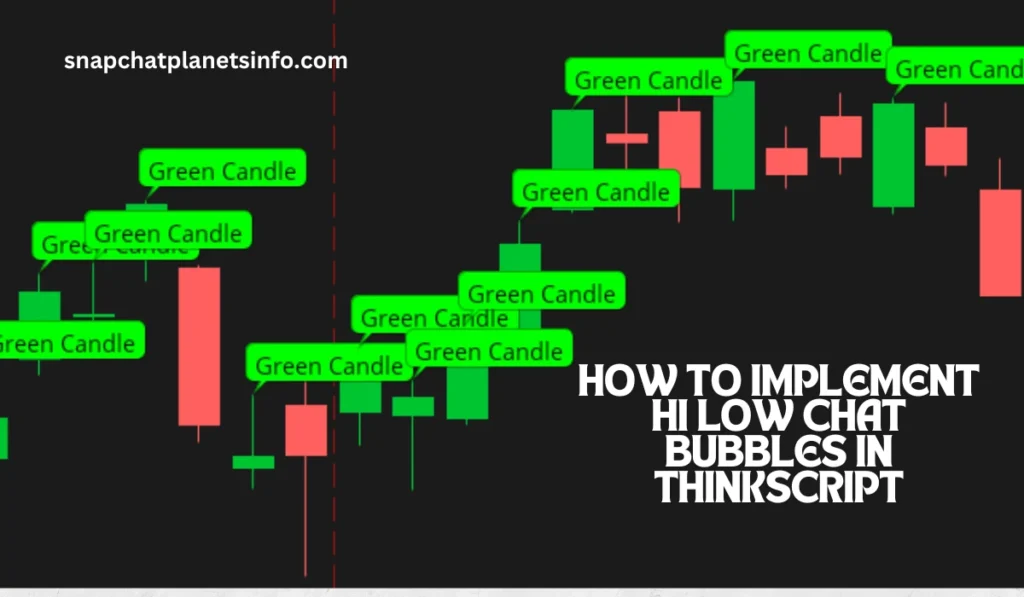
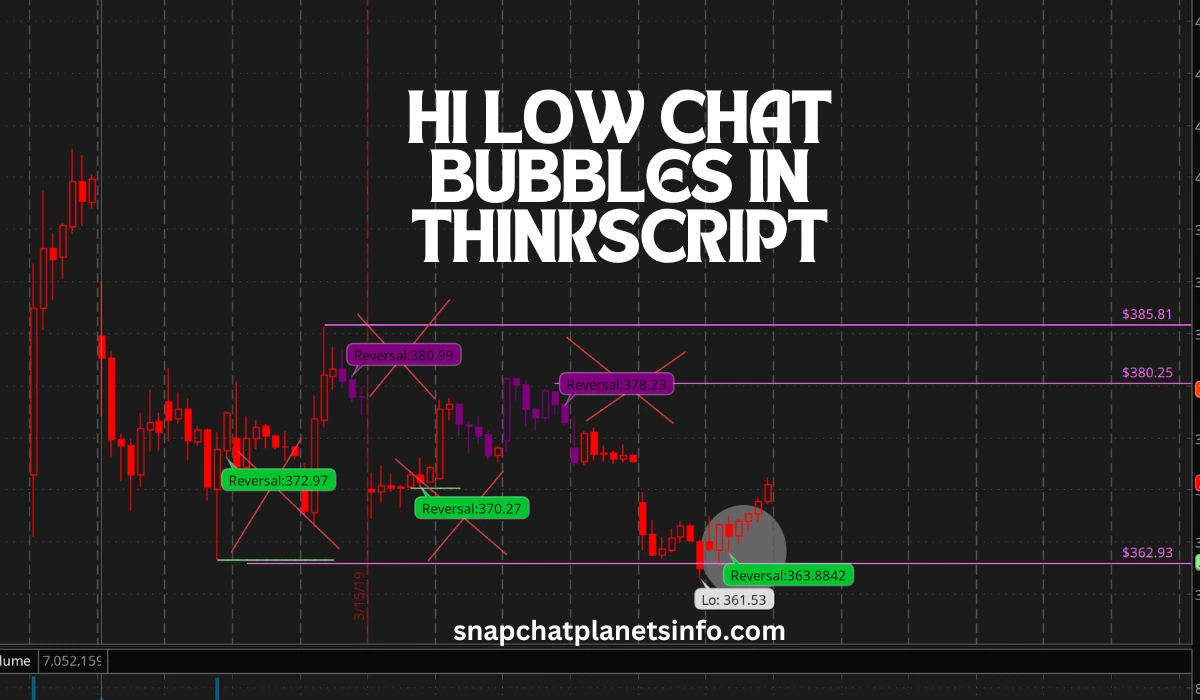
ThinkScript is a powerful scripting language used in the ThinkorSwim platform to create custom indicators and visual enhancements for stock charts. Among its various functionalities, one of the most visually intuitive features is the ability to create Hi Low Chat Bubbles in ThinkScript. These bubbles can mark significant high and low points on a chart, making it easier to analyze trends and key price levels.
In this article, we’ll delve into what hi low chat bubbles are, how to use them effectively, and why they’re essential for traders. By the end, you’ll clearly understand how to implement these bubbles and tailor them to suit your trading strategies.
Understanding Hi Low Chat Bubbles in ThinkScript
Hi low chat bubbles in ThinkScript are visual indicators that display bubbles at specific price points on a chart. These points can represent the highest or lowest highs within a particular time frame. The bubbles can include custom text, such as “High” or “Low,” to help traders quickly identify these critical levels without manually scrutinizing the chart.
For instance, if you’re tracking a stock’s price movement, you might want to highlight the highest price of the day or the lowest point of the previous week. Hi low chat bubbles provide this information directly on the chart, enhancing your decision-making process.
Why Use Hi Low Chat Bubbles in ThinkScript?
Trading involves analyzing vast amounts of data. Hi low chat bubbles simplify this process by visually marking pivotal price levels. Here are some reasons why traders love using them:
- Clarity: Instead of scanning through data, you can instantly see key price points.
- Customization: You can tailor the bubbles with text, colors, and conditions to fit your strategy.
- Efficiency: Highlighting highs and lows saves time and improves chart readability.
- Precision: The bubbles ensure you never miss important price movements.
| Feature | Details |
|---|---|
| Purpose | Highlight highs and lows on charts |
| Customization | Text, color, conditions |
| Applications | Swing trading, intraday trading |
| Best Practices | Use sparingly to avoid clutter |
How to Implement Hi Low Chat Bubbles in ThinkScript

Creating hi low chat bubbles in ThinkScript involves using the AddChartBubble function. This function enables you to define when and where bubbles appear on your chart. Below is an example script that highlights the highest highs and lowest lows over a specified period:
input length = 10;  # Lookback period for finding highs and lows
input showBubbles = yes;  # Toggle bubbles on/off
input highColor = Color.GREEN;  # Bubble color for highs
input lowColor = Color.RED;  # Bubble color for lows

# Identify high and low points
def highPoint = high == Highest(high, length);
def lowPoint = low == Lowest(low, length);

# Plot high and low points
AddChartBubble(showBubbles and highPoint, high, "High", highColor, yes);
AddChartBubble(showBubbles and lowPoint, low, "Low", lowColor, no);
This script creates bubbles at the highest and lowest points within the last 10 bars. You can customize the colors and text to align with your preferences.
To incorporate hi low chat bubbles in ThinkScript, you need to write or adapt code that defines how these markers appear on your chart. Here is a step-by-step guide to creating a basic script:
Step 1: Define the Variables
Begin by identifying the highest and lowest points within a specific range. For example, you might want the highest and lowest prices of the last 10 trading bars. ThinkScript provides built-in functions like Highest() and Lowest() to simplify this process.
Step 2: Plot the Bubbles
Next, use ThinkScript functions to add visual bubbles to the chart. The AddChartBubble() function is commonly used for this purpose. This function requires you to specify the location and text of the bubble, along with its appearance.
Read more: Rabbit chat
Here is an example code snippet:
input length = 10;

def high = Highest(high, length);
def low = Lowest(low, length);

AddChartBubble(high == high[length - 1], high, "Hi", Color.GREEN, yes);
AddChartBubble(low == low[length - 1], low, "Low", Color.RED, no);
In this example:
input lengthdefines the range (10 bars).Highest()andLowest()calculate the hi and low values within the range.AddChartBubble()plots the bubbles, with customization for color and position.
Step 3: Customize the Script
Tailor the code to match your strategy. For instance, you might adjust the bubble’s colors, size, or text to align with your preferences. You can also add conditions for when the bubbles should appear, such as only after a significant price movement
Advanced Customization of Hi Low Chat Bubbles
While the basic implementation is useful, ThinkScript allows for advanced customization. You can modify the bubble’s appearance, add conditional logic, and even calculate dynamic levels like moving averages or pivot points. For example, here’s how you can add bubbles for the previous day’s high and low:
input aggregationPeriod = AggregationPeriod.DAY;
def prevHigh = high(period = aggregationPeriod)[1];
def prevLow = low(period = aggregationPeriod)[1];

AddChartBubble(IsNaN(close[-1]) and !IsNaN(close), prevHigh, "Prev High", Color.BLUE, yes);
AddChartBubble(IsNaN(close[-1]) and !IsNaN(close), prevLow, "Prev Low", Color.ORANGE, no);
This script highlights the high and low from the previous trading day, providing critical reference points for intraday trading.
Practical Applications of Hi Low Chat Bubbles
Hi low chat bubbles in ThinkScript are highly versatile and can be applied in various trading scenarios. For swing traders, these bubbles can highlight weekly or monthly high and low points, helping identify breakout levels. Intraday traders can use them to mark session highs and lows for scalping opportunities.
Additionally, combining hi low chat bubbles with other indicators like moving averages or RSI can enhance their effectiveness. For instance, if a stock’s low aligns with an oversold RSI, it might signal a potential reversal.
Limitations to Consider
While hi low chat bubbles are powerful, they are not without limitations. Traders should be mindful of the following:
- Lagging Indicators: Hi low chat bubbles reflect past price data, which may not always predict future movements.
- Overcrowding: Too many markers on a chart can make it cluttered and harder to read.
- Complexity: Customization requires a basic understanding of ThinkScript, which can be a learning curve for beginners.
Practical Applications
Hi low chat bubbles in ThinkScript are versatile tools that can be used in various scenarios. Here are some examples:
- Day Trading: Quickly identify intraday high and low levels to set entry and exit points.
- Swing Trading: Analyze longer-term price movements to determine trends and reversals.
- Backtesting: Use the script to review historical data and assess the effectiveness of your strategy.
Read more: Ai mick weeler chat
Key Functions for Hi Low Chat Bubbles in ThinkScript
| Function | Purpose | Example Usage |
|---|---|---|
Highest() | Finds the highest price in a range | Highest(high, 10) |
Lowest() | Finds the lowest price in a range | Lowest(low, 10) |
AddChartBubble() | Plots visual bubbles on the chart | AddChartBubble(condition, value, text, color, up) |
input | Allows customization of variables | input length = 10; |
def | Defines variables for use in the script | def high = Highest(high, length); |
Frequently Asked Questions
What are hi low chat bubbles in ThinkScript?
Hi low chat bubbles are visual indicators that highlight the highest and lowest price points on a ThinkorSwim chart. They make it easier for traders to identify key levels quickly.
Can I customize the appearance of hi low chat bubbles?
Yes, you can customize their color, size, and text. You can also set conditions to determine when and where they appear.
Do hi low chat bubbles work for all time frames?
Yes, you can apply them to any time frame, from intraday charts to daily or weekly charts.
Are hi low chat bubbles suitable for beginners?
Absolutely! They’re easy to use and provide valuable insights, making them an excellent tool for traders of all levels.
Conclusion
Hi low chat bubbles in ThinkScript are a powerful feature that enhances chart analysis by marking significant price levels visually. Whether you’re a beginner or an experienced trader, these bubbles can simplify your workflow, improve accuracy, and save time. By customizing them to suit your strategy, you can unlock their full potential.
